Thats a really bad representation of the election results. Binary brain is strong with whoever made that.
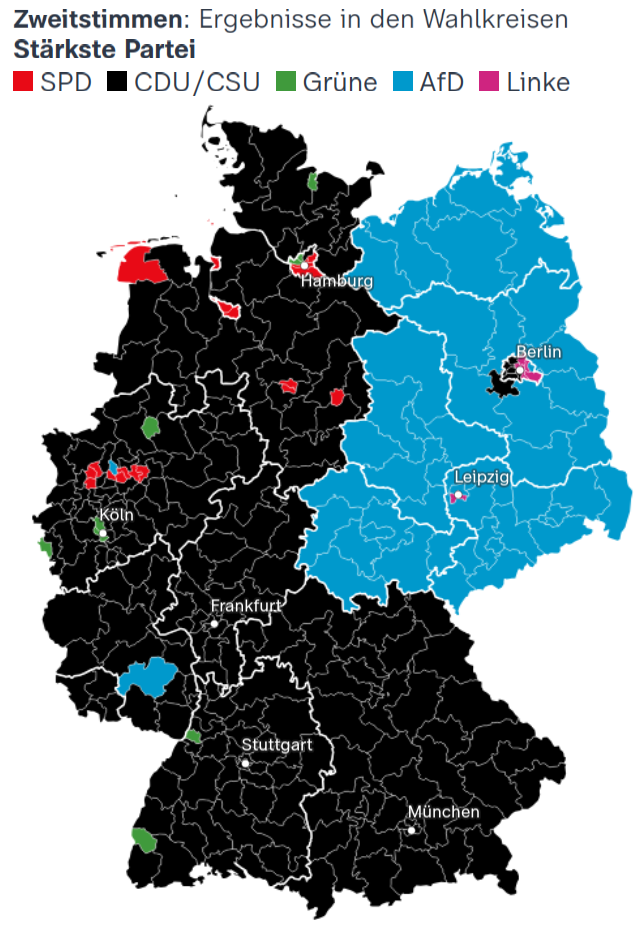
The best way would be a gradient that shows how left or right leaning the result was overall. This just shows the largest party, but nothing about majorities.
That is the representation of the second vote.
In Germany you have two votes: One for a local representative, the second for the party List/ percentage representation in the Bundestag. The map shows the strongest party in each district according to the second vote. It serves to highlight trends. The overall election result is here:


Thats a really bad representation of the election results. Binary brain is strong with whoever made that.
The best way would be a gradient that shows how left or right leaning the result was overall. This just shows the largest party, but nothing about majorities.
That is the representation of the second vote.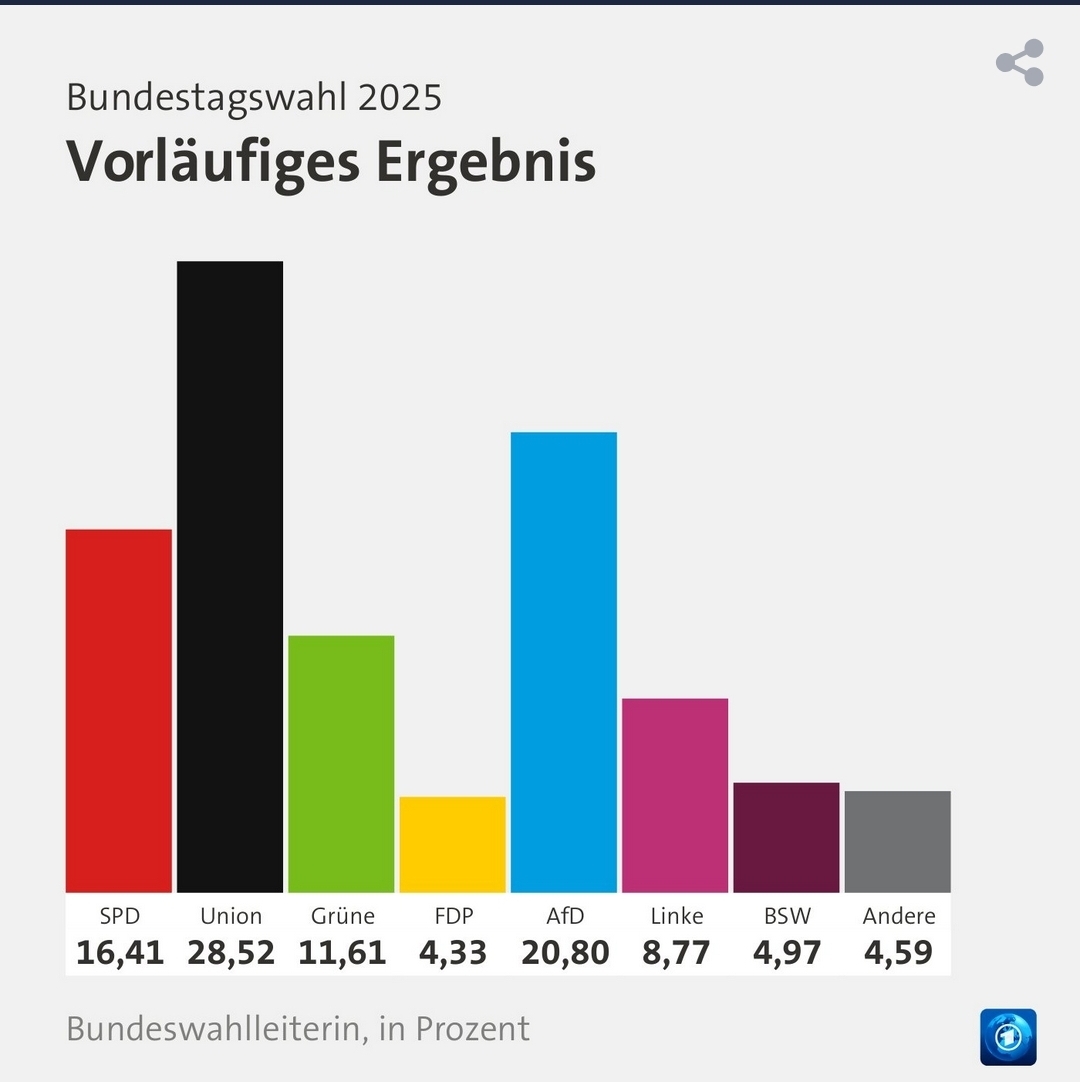
In Germany you have two votes: One for a local representative, the second for the party List/ percentage representation in the Bundestag. The map shows the strongest party in each district according to the second vote. It serves to highlight trends. The overall election result is here: